Executive Summary
IT security and security compliance are expensive to successfully achieve. Now pile on privacy
compliance and an array of regulatory compliance obligations and the costs skyrocket.
The key to getting the IT Security Governance committee to fund the appropriate compliance budget is to
speak their language.
In order to do that, risks need to be expressed in terms of costs for executives. Specifically costs need to
be identified as: Potential cost of losses, mitigation costs, the total costs (potential cost of losses +
mitigation costs) and residual costs.
In order to be clear and meaningful for the intended audience, the material should be presented
graphically, presenting changes in both cost and risk over time.
This trending analysis is most useful for supporting the ability of the IT Security Governance committee to
make well informed decisions on how to most effectively invest in security, thereby deriving optimal
payback for stakeholders.
Identifying Risk and its Business Impact
The costs of risk associated with IT security / privacy and non compliance of regulatory / standards and
the resulting negative impact on business can be broadly identified as follows:
- Loss of revenue or production due to unavailability of production resource.
- Time and effort to recover from a security related loss of production.
- Legal.
- Damage to brand.
- Regulatory compliance violations.
- Privacy compliance violations.
- Damage to client and vendor relationships.
- Loss of intellectual, competitive or proprietary information.
- Un-captured profits resulting from inability to demonstrate to clients / vendors / partners a strong security process.
The cost of risk is the resulting impact on business that may be incurred should a risk become a reality or
an event. Determining the cost of a potential event is difficult at best. However, it can be accomplished
by employing one or more quantitative and qualitative methods, and should be undertaken by those most
qualified to do so.
Those most qualified are unit profit and loss managers, stakeholders, and executives with insight into
quantitatively how an event would affect their work domain.
The cost of various types of events can be viewed as categories of low, medium, and high cost. This
qualitative analysis is not useful in itself, but it may assist management on how to prioritize the order in
which they will perform a more in depth risk analysis.
The next logical step would be to associate an actual cost to each event. Various methods can be used
either separately or together with the implementation of an averaging metric to estimate the cost per
occurrence of an event. These methods may include:
- Soliciting expert advice from financial management, lawyers, and risk management consultants.
- Conducting a straw poll of stakeholders, each estimating the downside cost of an event.
- Participating in a fact gathering survey of similar businesses, each of which provides factual and straw poll estimates of the cost of an event.
- Purchasing statistical information from industry experts regarding the cost of an event.
- Obtaining statistical information from industry associations about the cost of an event experienced by their membership.
Using a similar methodology, the next step is to determine the likelihood of an event occurring. The most
useful ways of expressing likelihood is in % chance of an event occurring in any one year.
However, any likelihood estimate should also be adjusted to account for changes in security environment.
There are typically evolving waves of new threats that may affect likelihood of occurrence, such as these
previous waves:
- Viruses
- Malware of all sorts
- DDOS
- Identity Theft
The likelihood estimate can then be used to:
- Qualitatively express cost vs. likelihood as in Exhibit 1 - Potential Cost vs. % Probability of Occurrence.
-
Calculate the quantitative Annual Loss Expectancy.
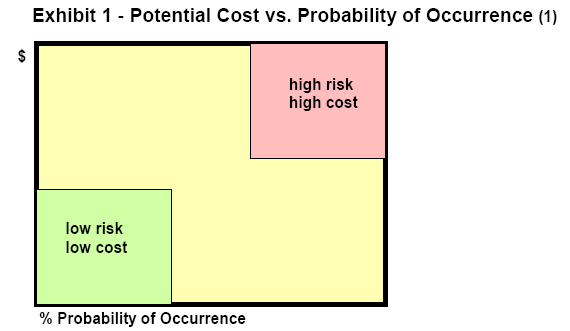
Obviously want to prioritize the mitigation steps to dealing with high risk / high cost situations first.
Annual Loss Expectancy (ALE) (2)
The step from qualitative to quantitative risk analysis logically occurs at this point, where the team
evaluating risk triages the results of Exhibit 1 in order to decide upon those risks where they intend to
focus.
The potential cost of those risks can be determined by calculating their Annual Loss Expectancy. The
annual loss expectancy is the annualized estimated cost for the occurrence of any type of event. This
number is useful for comparison with the annual cost of mitigation. ALE for an event is calculated by
multiplying the previously determined of the cost of the event and the chance of its occurrence.
Annual loss expectancy = cost of event x chance of occurrence
Calculating the Cost of Mitigation
Security professionals are well acquainted with determining the costs of mitigation. Senior executives
sometimes think they too are familiar with these costs, based upon ads they read about anti-virus and
firewall technology.
The danger here is that it is too easy for all concerned to focus on technology as the primary mitigation for
security and compliance. It is well documented in standards published by industry experts such as NIST-
88 series (3), ISACA CoBIT (4), PCI Security Standards PCI (5), and NERC CIP 02 09 (6).
It is well advised to consider mitigation steps that include:
- Re-engineering processes, both technological and people processes.
- Policy people and technology
- Technical security.
- Physical security.
- People processes.
- Training and awareness.
- Third party auditing to verify the effectiveness of all the above.
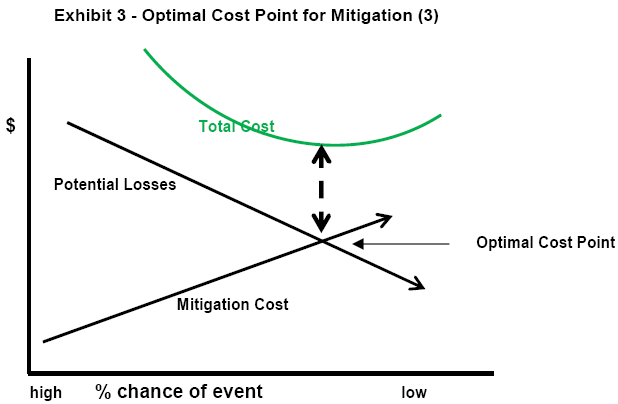
From an IT Security Governance perspective the optimal cost point for mitigation is where the total costs
of risk and mitigation are lowest. This point can be graphically determined as in Exhibit 3 Optimal Cost
Point for Mitigation.
Once mitigation costs are determined, it is important to express to the IT Security Governance committee
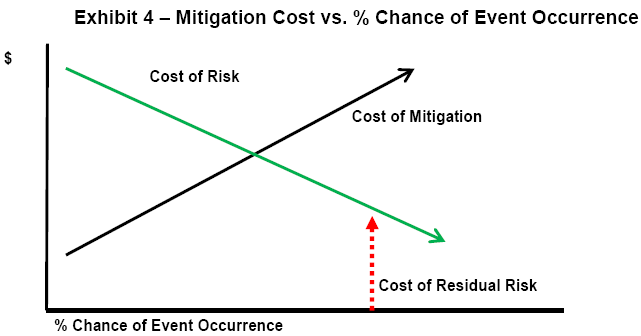
that mitigation only goes so far, and that some residual risk remains even after spending on mitigation.
The residual risk can be expressed as the cost of risk that remains after mitigation is implemented. As
shown in Exhibit 4 Mitigation Cost vs. Chance of Event Occurrence, expenditures on mitigation reduce
the cost of exposure to risk.
The IT Security Governance Committee may decide to deal with residual risk by:
- Accepting the risk.
- Moving the risk (insurance).
- Further mitigation.
Calculating Return on Security Investment (ROSI) (7)
Once the total cost of security mitigation is determined by including any costs for managing residual risk,
then it is straightforward to calculate the return on security investment, as follows:
ROSI = cost of mitigation / cost of risk
When calculating ROSI it is important to allocate mitigation costs on a pro-rated basis across all costs of
risk to which they apply. In this way ROSI can be more accurately calculated and evaluated by each
profit and loss manager and associated stakeholder.
Measuring the Effectiveness of Mitigation
It is paramount to close the risk management loop by comparing planned and actual results of mitigation.
Goal is to clearly identify if risk level has changed and what consistent metrics will be used upon which to
base a conclusion. Once again, this may be difficult to accomplish directly, but there certainly are metrics
for measuring and comparing the results of implementing mitigation. The metrics should always:
- Produce repeatable, consistent results.
- Be understandable.
- Be reasonably simple to use over time.
The following is a good starting list of metrics that can be used for consistently measuring and reporting
on risk:
-
Architectures for measuring risk Enterprise Information Security Architecture (EISA) (8), (9)
- The U.S. Department of Defense (DoD) Architecture Framework (DoDAF). (10)
- Extended Enterprise Architecture Framework (E2AF) from the Institute For Enterprise Architecture Developments. (11)
- Federal Enterprise Architecture of the United States Government (FEA). (12)
- Capgemini's Integrated Architecture Framework. (13)
- NIH Enterprise Architecture Framework. (14)
- Open Security Architecture. (15)
- The Open Group Architecture Framework (TOGAF). (16)
- Zachman Framework. (17)
- Control points from the COBIT framework. (18)
- Vulnerability assessments.
- Penetration tests.
- Time trends in frequency of occurrence and the real costs of security events, privacy violations, and policy compliance violations.
- Time trends in cost to recover from events.
- Time trends in frequency of policy compliance violations that do not necessarily cause any financial losses, such as identifying Trojans, viruses, rootkits, unauthorized logins, attempted port scans, frequency of dropped packets, frequency of password lifecycle, breaches, and frequency of rescheduled / cancelled IT Security Governance meetings with business managers.
Determining if ROSI Objectives are Met
Tires meet the road when it is time to determine whether or not ROSI objectives for security / policy /
compliance have been met. Conveying this determination is essential to building (or destroying)
credibility of the group who made the mitigation recommendations in the first place.
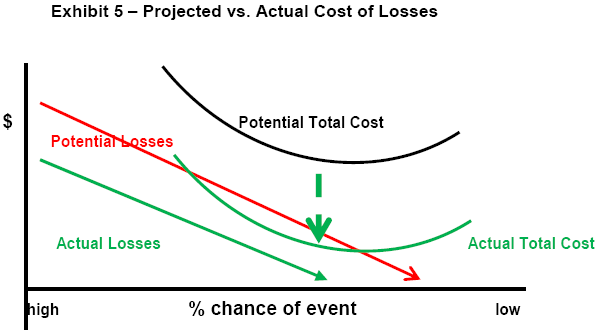
Determining ROSI is quite simple. The actual costs resulting from events are compared with the projected
costs after mitigation. If mitigation was successful, then the actual costs should be near or below the
projected costs. This information can be presented as an updated version of Exhibit 3, shown as
Exhibit 5 Projected vs. Actual Cost of Losses. For purposes of accuracy new trends that developed in
the security environment over the period of study should be considered. If new trends increased the cost
of losses, and the effect can be quantified, then the results should be reported accordingly.
Summary
The task of getting approval for a sufficient budget for IT security, privacy compliance, and IT regulatory
compliance is usually frustrating and arduous. The task can be made easier by presenting the IT Security
Governance body with simple to understand graphics, rather than with complex business plans. The
graphs should depict the relationship between the cost of risk and the cost of mitigation. The
presentation process should occur both at budget request time to show the intended plan, and after the
budget cycle to show the actual results. Hopefully the results trump the plan.
Sources of Information
(1) ANZ 4360:2004 Risk Management Standard http://www.ncsi.com.au/as4360.html
(2) Calculations of ALE are based upon The Official CISSP CBK, 2009, published by ISC2 www.isc2.org
(3) NIST- 88 series http://csrc.nist.gov/publications/PubsSPs.html
(4) ISACA: CISM Review Manual 2010 www.isaca.org
(5) PCI Security Standards PCI https://www.pcisecuritystandards.org/index.shtml
(6) NERC CIP 02 09 www.nerc.com
(7) ROSI Calculating Security Return on Investment, Don O'Neil Software Engineering Institute, 2007, CERT
https://buildsecurityin.us-cert.gov/daisy/bsi/articles/knowledge/business/677-BSI.html
(8) Gartner whitepaper:"Incorporating Security into the Enterprise Architecture Process," Jan 2006 www.gartner.com
(9) EISA: http://en.wikipedia.org/wiki/Enterprise_information_security_architecture
(10) The U.S. Department of Defense (DoD) Architecture Framework (DoDAF) http://www.architectureframework.com/frameworks/dodaf/
(11) Extended Enterprise Architecture Framework (E2AF) from the Institute For Enterprise Architecture Developments.
http://www.enterprise-architecture.info/
(12) Federal Enterprise Architecture of the United States Government (FEA) http://www.whitehouse.gov/omb/e-gov/fea/
(13) Capgemini's Integrated Architecture Framework
http://www.capgemini.com/services-and-solutions/technology/soa/overview/ent_architecture/iaf/
(14) NIH Enterprise Architecture Framework http://enterprisearchitecture.nih.gov/About/Approach/Framework.htm
(15) Open Security Architecture http://www.opensecurityarchitecture.org/cms/index.php
(16) The Open Group Architecture Framework (TOGAF) http://www.opengroup.org/architecture/togaf8-doc/arch/
(17) Zachman Framework http://www.zifa.com/
(18) Contact ERE for a copy of the document "Control Points from the COBIT framework", which was previously posted at
http://www.isaca.org/Template.cfm?Section=COBIT6&Template=/TaggedPage/TaggedPageDisplay.cfm&TPLID=55&ContentID=7981
About the Author
Ron Lepofsky B.A. SC. (Mech Eng), CISSP is the President of ERE Information Security and Compliance Auditors. www.ere-security.ca
|